Quoting Professor Norman Fenton of Queen Mary University of London from his most recent paper:
Is the pattern of mortality what we might expect to see?
Next, we can use the death counts from the ONS registered deaths in week 26 to estimate the expected deaths for each age category in the unreleased PHE/ONS report. This is done using proportional allocation, which assumes the all-cause mortality rates are independent of vaccination status (and hence implicitly assuming vaccines have no impact on all-cause mortality). When the PHE/ONS release their data, we can test whether the pattern deviates significantly from this assumed independence. For now, all we can do is compare the total death counts given this is what PHE/ONS have released.
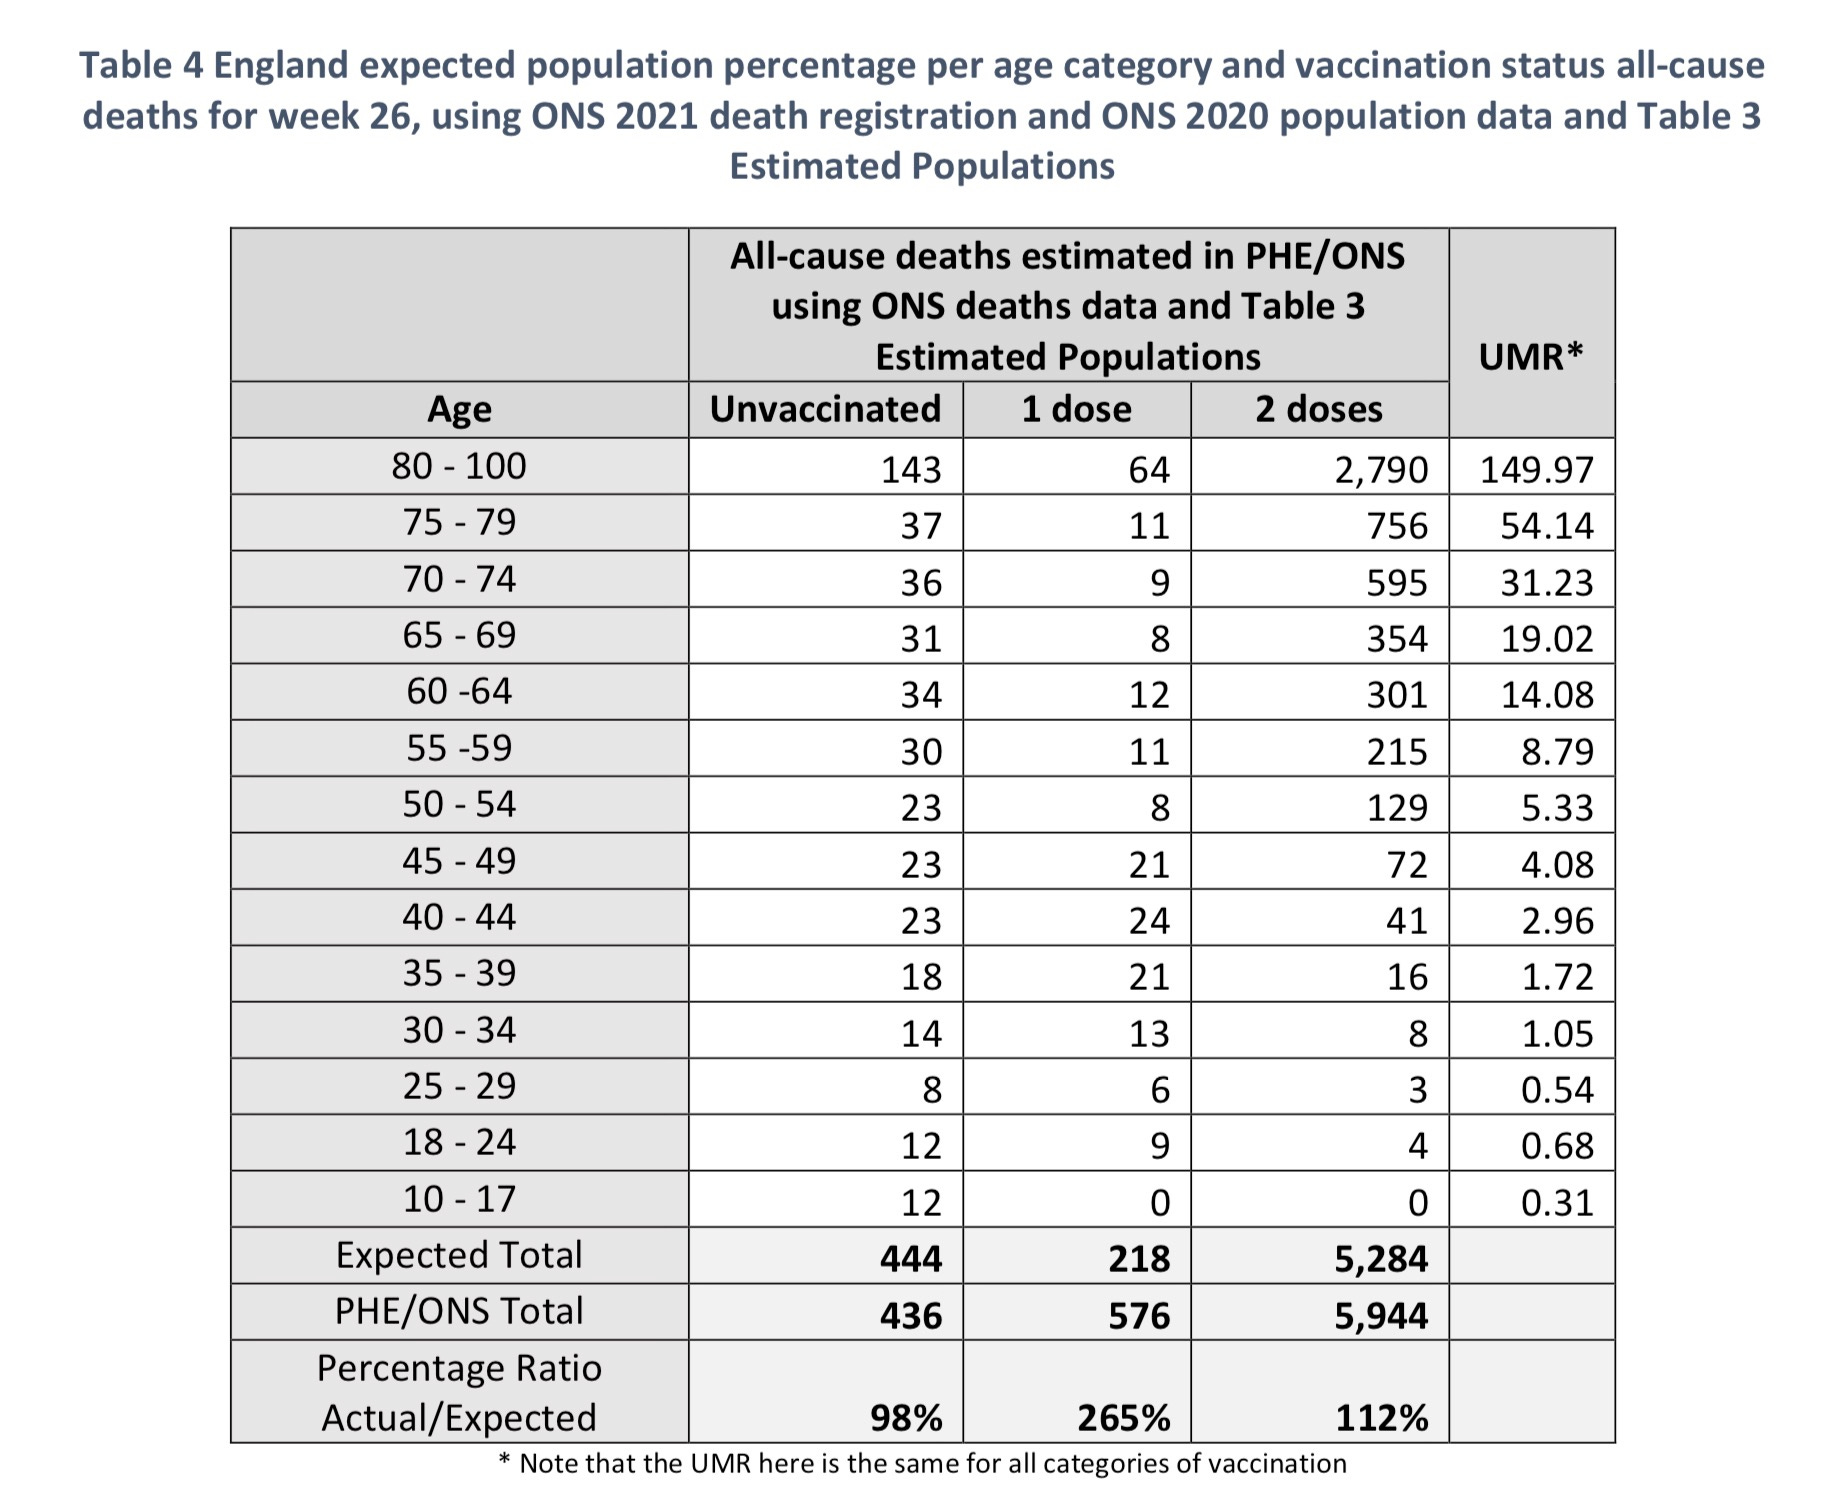
As we have said we have had to pro-rate the ONS registered deaths in week 26, to take account of differences between England & Wales and England. We can do this again for deaths in each age category and then use the ONS 2020 population survey to calculate the UMR for each age category. When we apply this UMR to the estimated populations in Table 3, we get the results shown in Table 4.
Table 4 England expected population percentage per age category and vaccination status all-cause deaths for week 26, using ONS 2021 death registration and ONS 2020 population data and Table 3 Estimated Populations
* Note that the UMR here is the same for all categories of vaccination
Notice that the Expected Total all-cause deaths (summing the totals of the three columns) is 5,945 whilst the PHE/ONS Total sums to 6,956. This is a significant difference. Likewise, when we compare the expected deaths versus actual deaths for each of the vaccination categories there is close alignment for the unvaccinated categories (444 versus 436), less so for the 2-dose vaccinated (5,284 versus 5,944) and much less so still for the single dose vaccinated (218 versus 576). The ratio of actual to expected is over 250% in the single dose vaccinated and 112% in the two-dose vaccinated.
We already noted earlier those 1,236 deaths of over-10s deaths in England during week 26 are unaccounted for (based on our estimate of 8,192 and the PHE/ONS mortality report number 6,956). It might be reasonable to expect that these occurred in the ‘missing’ 10 million.
The scary thing with regards to the Saskatchewan numbers is the province was undergoing a mass vaccination push (in the middle of a wave because Canadian health officials are idiots) as they imposed mandates everywhere and more vaccinated still died in that time period (37v vs 35 uv). Due to the 21 day rule and the amount of vaccinations in that time period likely accounts for a good chunk of the unvaccinated doses and at least a few of the deaths (if not more than a few).
Yes. This is the most vulgar misuse of government power over statistics to kill without a trace and use the killings to achieve their health policy goals. Sickening to the core.


https://twitter.com/mahmudme01/status/1448644758872621069?s=20
Work in Progress/Incomplete. Plan to add all datasets I find that can help misunderstand the missing pieces better.
The scary thing with regards to the Saskatchewan numbers is the province was undergoing a mass vaccination push (in the middle of a wave because Canadian health officials are idiots) as they imposed mandates everywhere and more vaccinated still died in that time period (37v vs 35 uv). Due to the 21 day rule and the amount of vaccinations in that time period likely accounts for a good chunk of the unvaccinated doses and at least a few of the deaths (if not more than a few).
Yes. This is the most vulgar misuse of government power over statistics to kill without a trace and use the killings to achieve their health policy goals. Sickening to the core.